Labour market analytics dashboard
AI Exposure and Vacancy Trends in Toronto Economic Region
A Power BI evidence product connecting public vacancy data with occupation-level AI exposure profiles.
Project purpose
A broad AI-labour debate needed a Toronto-specific vacancy check.
What the project adds
The project provides a Toronto-specific comparison of vacancy trends across occupational AI-exposure profiles, adding local evidence to a debate usually framed at the national level.
How the comparison was structured
Occupations were grouped by AI exposure and complementarity to compare whether higher-exposure profiles moved differently from lower-exposure work across 2023-2026.
Dashboard evidence
Power BI report export
One report page brings the indexed trend, profile definitions, and pre/post level-shift estimates together.
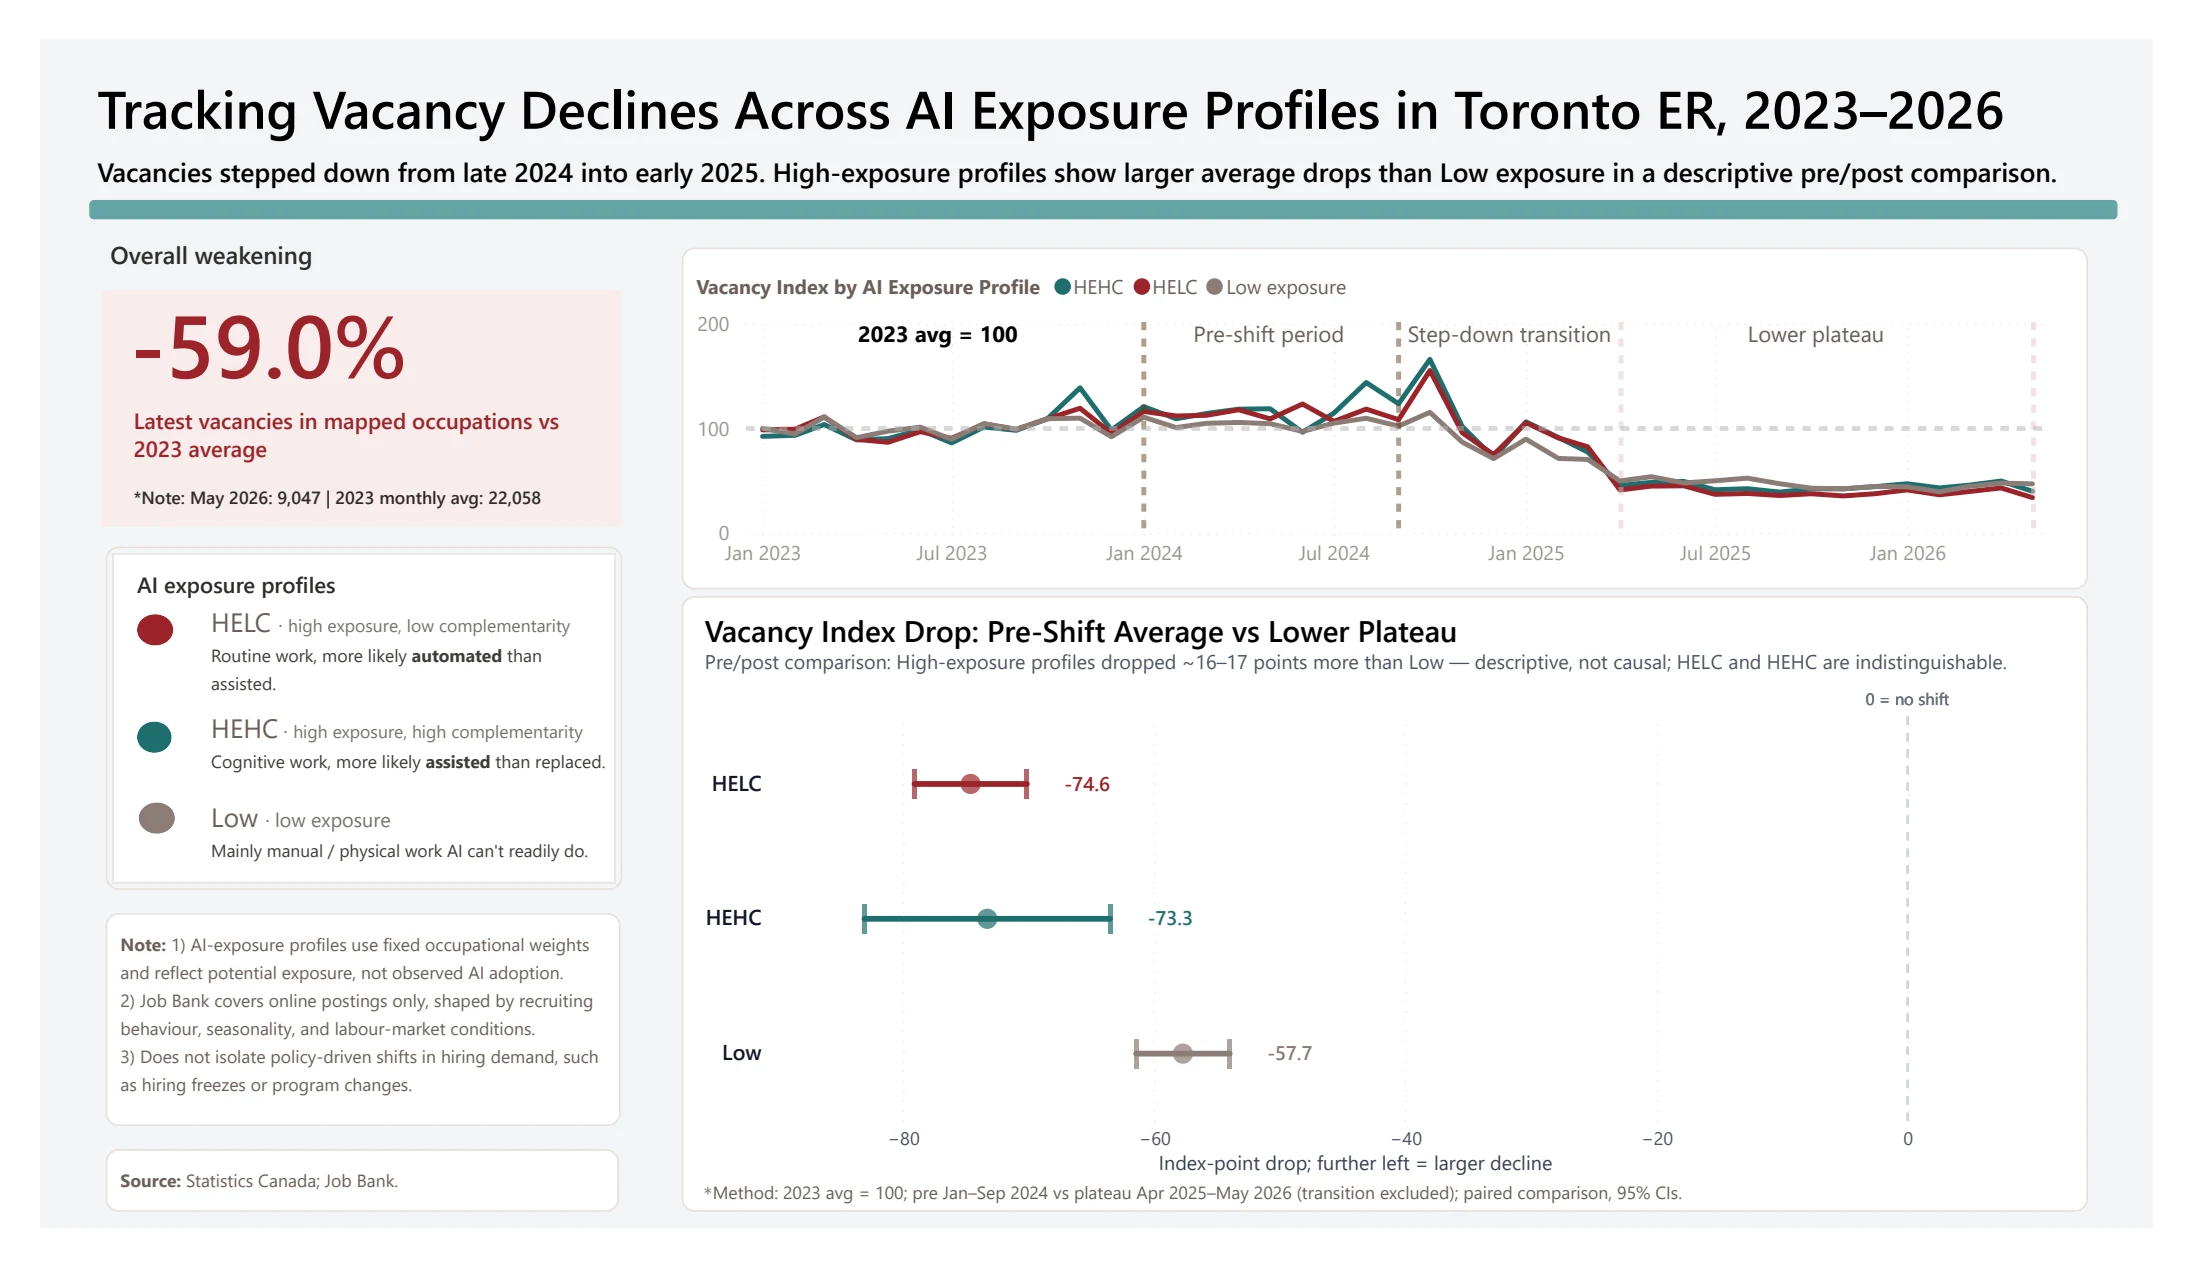
Final Power BI PDF export. Public embedding is unavailable due to admin permissions. Open PDF export
Building the indicator
Vacancies were weighted by the workforce profile behind each occupation group.
Job Bank provides vacancy counts by occupation group. The indicator applies Statistics Canada's occupation-level profile shares to those monthly counts.
One occupation group, one month
100 vacancies
Job Bank vacancy count
Weighted profile vacancies
35HELC
45HEHC
20Low exposure
Job Bank vacancies are regrouped and weighted by the StatsCan profile shares, then summed across occupation groups into three monthly profile-level vacancy series.
Calculation logic
Profile-weighted vacancies = occupation vacancies ×
profile share, summed across occupations
Vp,t =
Σo
Vacancieso,t × Shareo,p
Comparable scale
Index each profile to its own 2023 average.
Monthly index =
weighted vacancies ÷ profile's 2023 average × 100
Indexp,t =
Vp,t ÷
mean(Vp,2023) × 100
This changes the comparison from "which profile has more vacancies?" to "which profile changed more relative to its own baseline?"
These are exposure-weighted vacancy estimates derived from occupation profiles and vacancy counts.
Statistical evidence
Comparing earlier and recent vacancy levels.
The trend appears to move from an earlier stable baseline to a later lower plateau. The pre/post comparison quantifies how far each profile moved between those two levels.
Earlier vacancy level
Between the two levels
More recent vacancy level
Monthly vacancies fluctuate. Averaging each stable period reduces the influence of single-month highs or lows and gives a more representative comparison of the two levels.
Intervals show uncertainty around each profile's estimated pre/post level shift.
Pre-shift average 113.8; lower plateau 39.2. 95% CI [-79.1, -70.1].
Pre-shift average 117.8; lower plateau 44.5. 95% CI [-83.1, -63.5].
Pre-shift average 104.5; lower plateau 46.8. 95% CI [-61.4, -54.0].
Measured patternAll three profiles moved from a higher baseline to a lower recent level. HELC and HEHC show larger descriptive drops than Low exposure, while the two high-exposure profiles remain close to one another.
The confidence intervals quantify each profile's pre/post change. The difference between profiles is presented as a descriptive comparison, with each profile's uncertainty reported separately.
Next research ideas
What I would examine next.
The current dashboard is a descriptive signal check. A next version would add more time and economic context to see whether the pattern holds beyond the current vacancy window.
Methods and tools
Sources and interpretation: Statistics Canada's occupational AI exposure study and Job Bank vacancy data. AI-exposure profiles represent potential occupational exposure. Job Bank reflects online postings and is also shaped by recruiting behaviour, seasonality, policy, and broader labour-market conditions. Bank of Canada policy-rate data is identified as a future extension for a later version.